
 Tweet
Tweet
Here's a portion of the October 6, 2015 report:
Smart Trades Update 10.6.15
Summary:
Stocks look to have peaked or to be peaking longer term. The S&P finally broke 2040 - 2044 support. It's possible a
large scale decline is underway. The stock market is historically overdue for at least an intermediate term corrective
decline (10 - 20%), but it's possible a much larger scale decline is just beginning. I would look to sell corrective rallies.
A strong rally back above S&P 2044 calls the "top" into question, but may lead to a "flat" "B wave" peak near 2135.
Support to watch in the Dow is near 15,340. Please see new details below.
Charts and Analysis
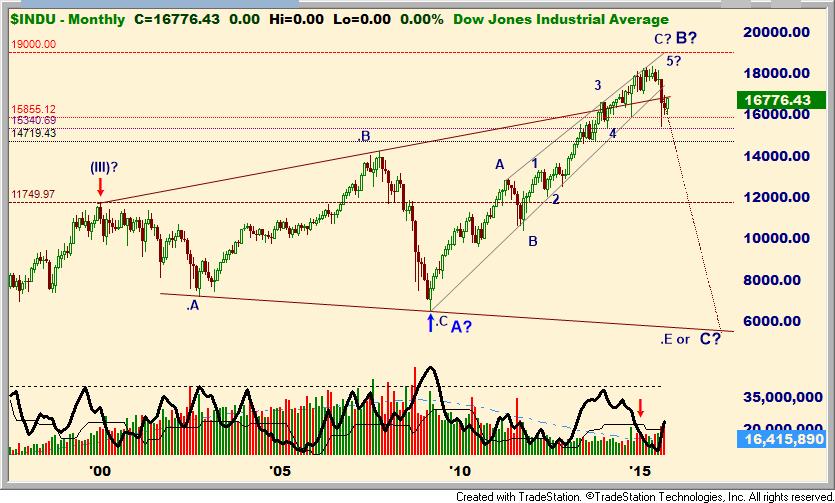
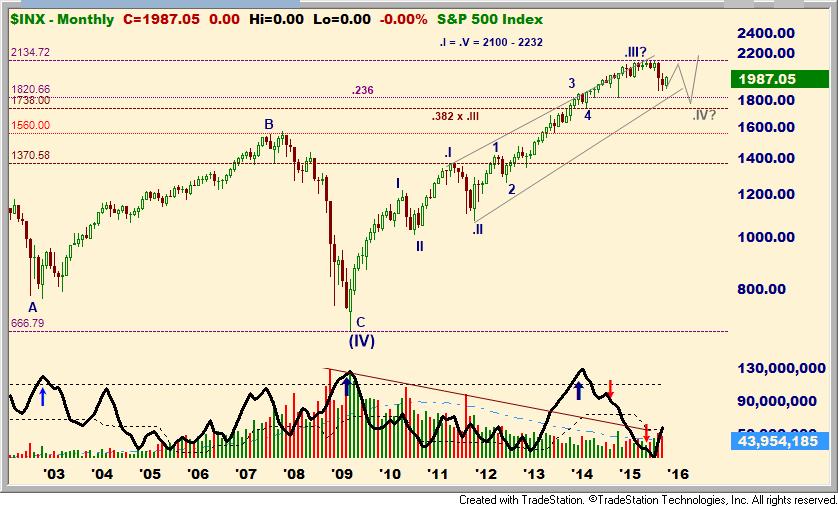
Here's our long term count of the Dow. This count assumes the rally from the 2009 low is a "B" wave in an ongoing
correction that started at the year 2000 peak. One issue with the count is that "B" is proportionally large relative to
"A" in respect to price.
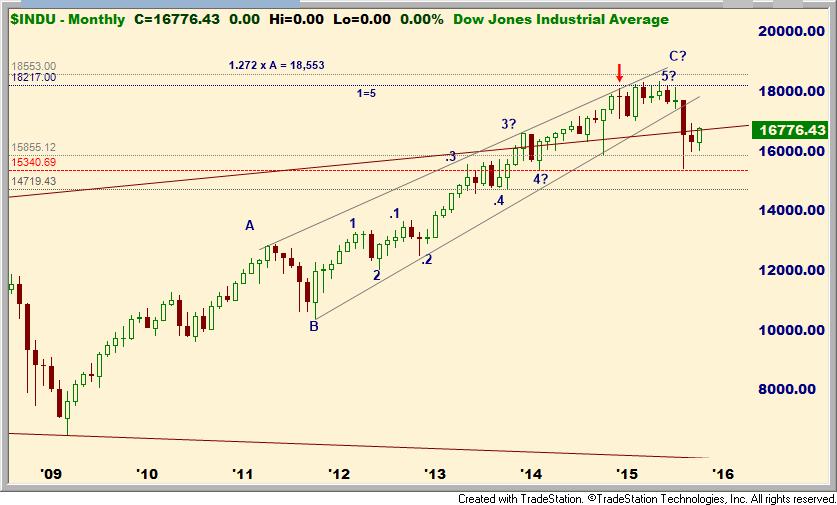
Here's a closer look at that same count. It assumes the top is in.
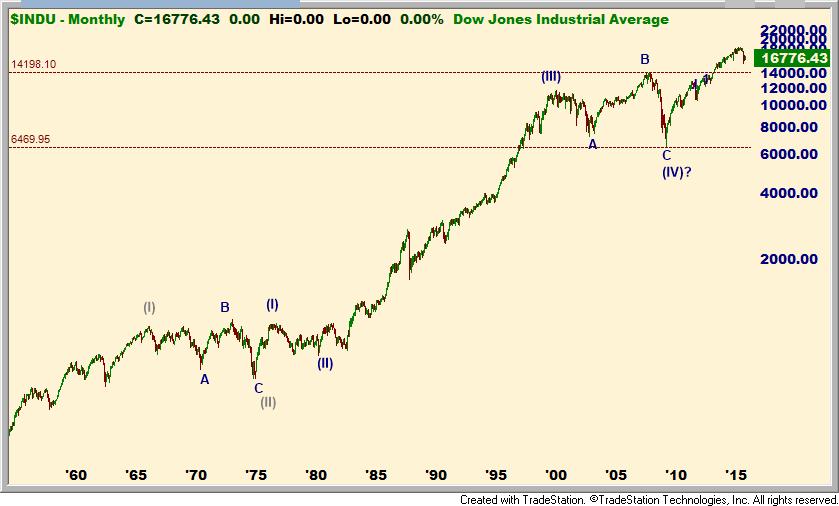
An alternate count we've discussed before assumes the 2009 low was the bottom in a "(IV)". This count also
favors an eventual retest of the 2009 low, but it allows for higher prices first.
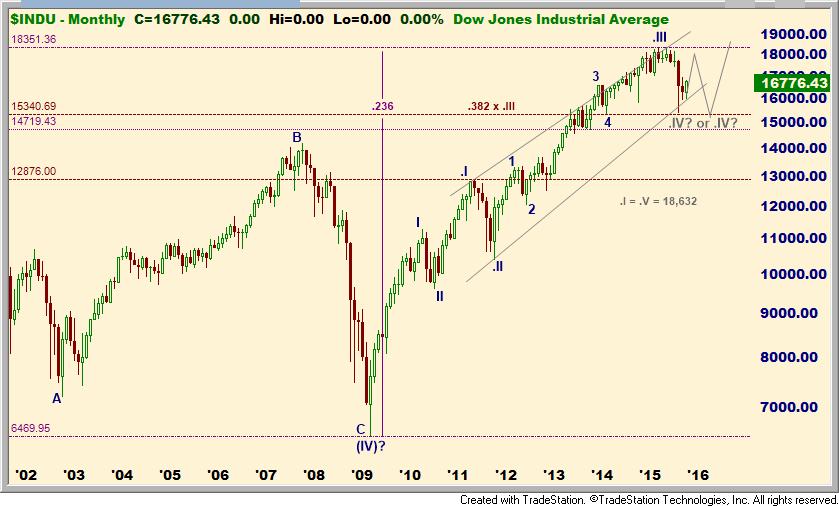
Previous "4" support is near Dow 15,340. Moreover, that area is about a 38% retracement of ".III" and a
23.6% retracement of the entire rally from the 2009 low. Alternation suggests that ".IV" will be a sideways
flat or a triangle (".II" was a steep "zig-zag"). A flat favors a rally back near 18,000 and then a retest
of 15,340. Assuming 15,340 holds, ".I=.V" would target the 18,632 area on a new high. Then back down
to 15,340 in "IV". A significant break of 15,340 (14,720 is next support) would probably negate this
scenario. A drop under 12,876 definitely kills the impulsive pattern.
(update note: the high was 17,977.85, the low as of 1.20.16 is 15,450.56)
Support for ".IV" in the S&P is near 1738 - 1820. A drop under 1370 breaks the impulsive pattern.
(update note: the S&P low as of 1.20.16 is 1812.29)
Resistance areas to watch for a possible ".B" wave peak in the S&P are 2020, 2044, and 2100 - 2135. I would
still be looking to sell corrective rallies when they terminate.
(update note: the S&P peaked at 2116.48 )
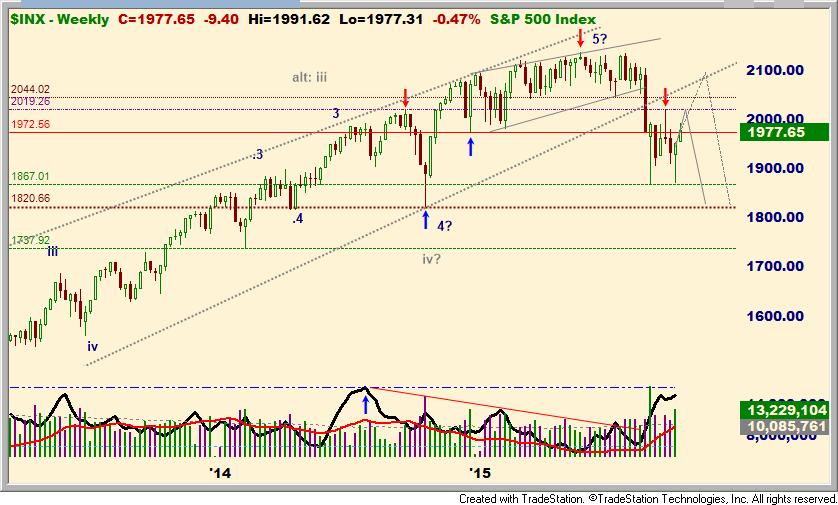
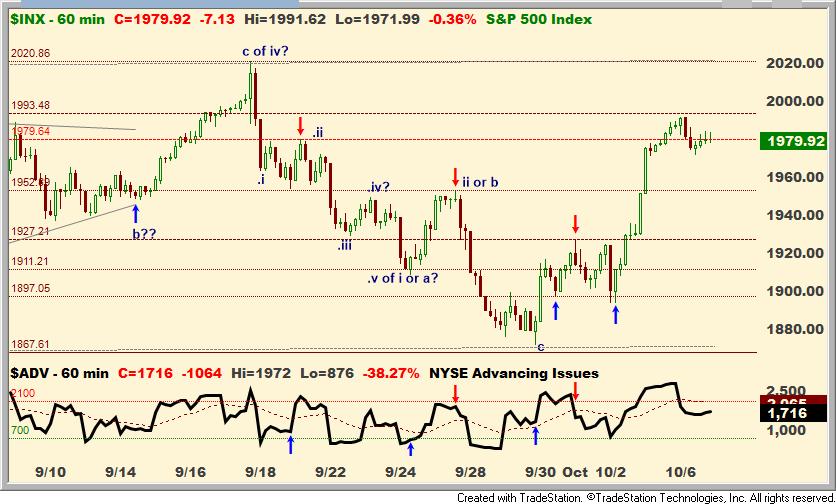
Shorter term the S&P is pointing higher, but likely in the context of a corrective rally.
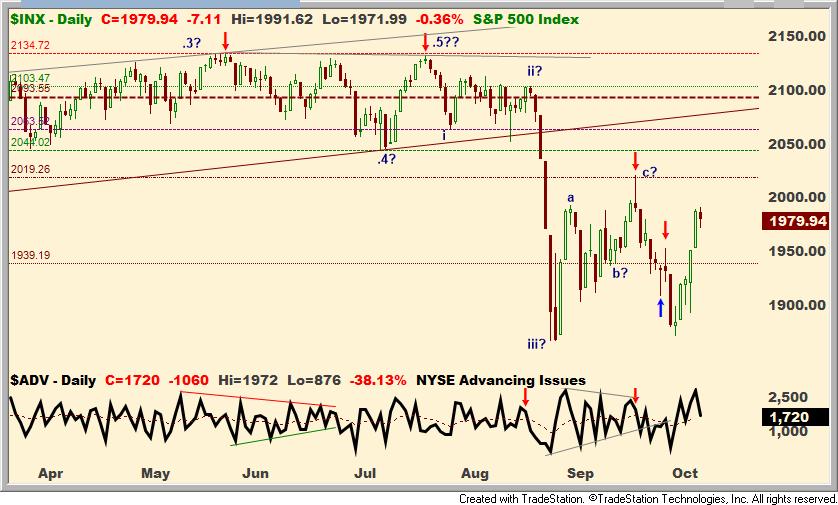
The ideal target for a ".C" wave termination is just above 2021 resistance. A strong push through 2044
suggests a more bullish pattern may be evolving. Ideal resistance for a large scale "flat" "B" wave
is near 2135. Short term resistance is near 1993.48.
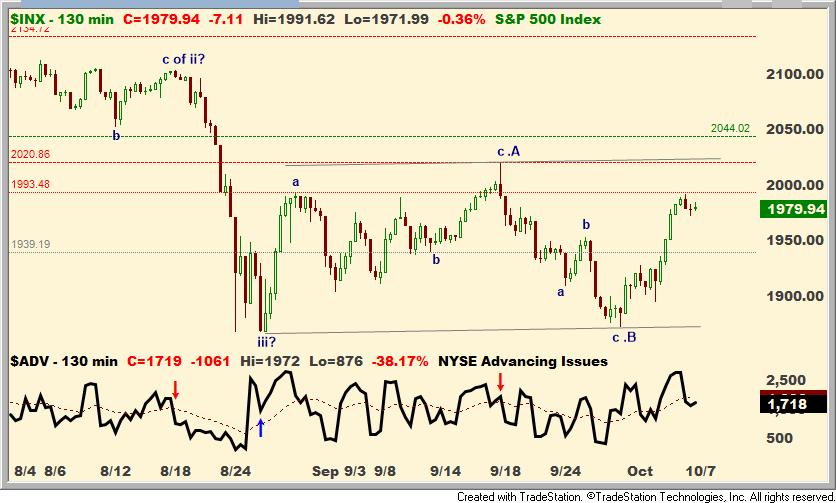
Breadth remains strong suggesting more upside short term.
Smart Trades Website: http://www.smarttrades.com/
Join me on Twitter @ https://twitter.com/#!/BillSmartTrades for live updates and real time trades.
If you join Twitter you can see updates on my twitter page, or texted to your phone: it's your choice
as to how to follow. I try to update on Twitter several times a day. Please be sure to email me your twitter handle
as I get lot's of unsolicited requests. Also, be sure to send a follow request via twitter: this must be initiated from your side.
Twitter help FAQ:
https://support.twitter.com/groups/34-apps-sms-and-mobile/topics/123-mobile-basics/articles/14014-twitter-phone-faq
If you like my reports, please refer a friend. I'll comp a free month for each paid referral subscription (a $49 value).
Elliott Wave basics:
http://stockcharts.com/school/doku.php?id=chart_school:market_analysis:elliott_wave_theory
Candlestick basics:
http://www.investopedia.com/articles/technical/02/121702.asp
http://www.investopedia.com/terms/d/doji.asp
http://www.investopedia.com/terms/g/gravestone-doji.asp
http://www.investopedia.com/terms/d/dragonfly-doji.asp
Market Breadth, Advance / Decline:
http://www.investopedia.com/university/marketbreadth/marketbreadth3.asp
Entire publication © Smart Trades Inc. 2015 All rights reserved.
All Charts & Quote Pages in this publication created with TradeStation (r) 9, copyright TradeStation Technologies.
This post is for educational purposes only.
TRADE AT YOUR OWN RISK!
NOTICE: Traders can and do lose money. No claims are made that the information provided here will insure gains or prevent loses.
NOTICE: Neither the information, the systems, nor any opinion expressed herein constitutes a representation by Smart Trades Inc., or a solicitation for the purchase or sale of any commodity futures, stocks or options of any kind. Those using the information and systems herein for trading purposes are responsible for their own actions and no claim is made that the recommendations or systems will be profitable or that they will not result in losses. Smart Trades owners, employees, or members of their families may have a position in the markets contrary to the information or systems contained herein.
NO CLAIMS ARE MADE THAT THE INFORMATION PROVIDED HERE IS CORRECT. EPS, YIELDS, ETC. ARE SUBJECT TO CHANGE.
TRADE AT YOUR OWN RISK!
PLEASE NOTE THAT THERE IS AN INHERENT RISK OF LOSS ASSOCIATED WITH TRADING FUTURES, STOCKS AND OPTIONS CONTRACTS, EVEN WHEN USED FOR HEDGING PURPOSES. PLEASE CAREFULLY CONSIDER YOUR FINANCIAL CONDITION BEFORE INVESTING IN FUTURES AND OPTIONS CONTRACTS. FUTURES AND STOCK TRADING IS NOT SUITABLE FOR ALL INVESTORS. NO CLAIMS ARE MADE THAT THE INFORMATION PROVIDED HERE WILL INSURE GAINS OR PREVENT LOSES.
PAST PERFORMANCE IS NOT NECESSARY INDICATIVE OF FUTURE RESULTS.
This post is for educational purposes only.
TRADE AT YOUR OWN RISK!
All Charts & Quote Pages in this publication made with Omega Trade Station (r) 8
NOTICE: Traders can and do lose money. No claims are made that the information provided here will insure gains or prevent loses.
NOTICE: Neither the information, the systems, nor any opinion expressed herein constitutes a representation by Smart Trades Inc., or a solicitation for the purchase or sale of any commodity futures, or options of any kind. Those using the information and systems herein for trading purposes are responsible for their own actions and no claim is made that the recommendations or systems will be profitable or that they will not result in losses. Smart Trades owners, employees, or members of their families may have a position in the markets contrary to the information or systems contained herein.
PLEASE NOTE THAT THERE IS AN INHERENT RISK OF LOSS ASSOCIATED WITH TRADING FUTURES, STOCKS AND OPTIONS CONTRACTS, EVEN WHEN USED FOR HEDGING PURPOSES. PLEASE CAREFULLY CONSIDER YOUR FINANCIAL CONDITION BEFORE INVESTING IN FUTURES AND OPTIONS CONTRACTS. FUTURES AND STOCK TRADING IS NOT SUITABLE FOR ALL INVESTORS. NO CLAIMS ARE MADE THAT THE INFORMATION PROVIDED HERE WILL INSURE GAINS OR PREVENT LOSES.
TRADE AT YOUR OWN RISK.
PAST PERFORMANCE IS NOT NECESSARY INDICATIVE OF FUTURE RESULTS.