
 Tweet
Tweet
Smart Trades Inc.
Expert market forecasting services
Excerpts from recent newsletters:
Summary:
Stocks look to be peaking longer term, but as long as intermediate term support holds, another run at the upper channel is possible (S&P 2150, Dow 18,500). The Nasdaq made new highs and tested its upper channel against a backdrop of relatively weak breadth. *If* the Nasdaq can hold 4555, a run at long term resistance near 4816 is possible. However, the Nasdaq declined sharply off its upper channel creating a short term peak, maybe something more. I would sell corrective rallies with care, understanding a retest of the upper channel, or possibly 4816, is still possible.
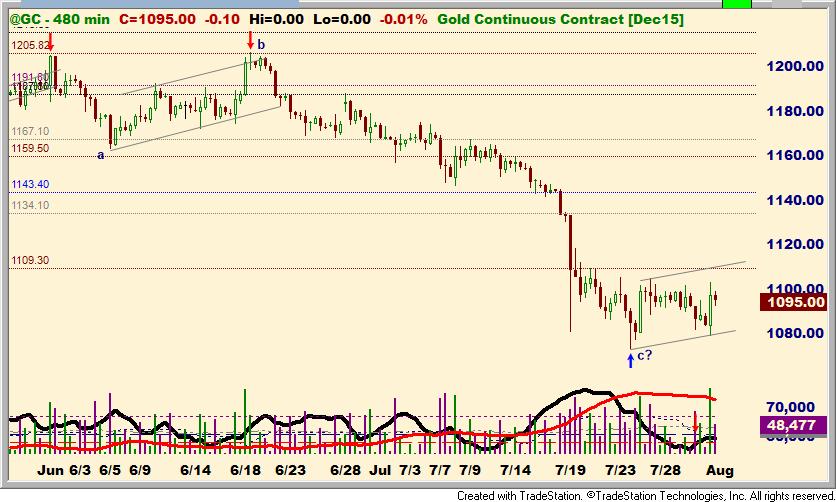
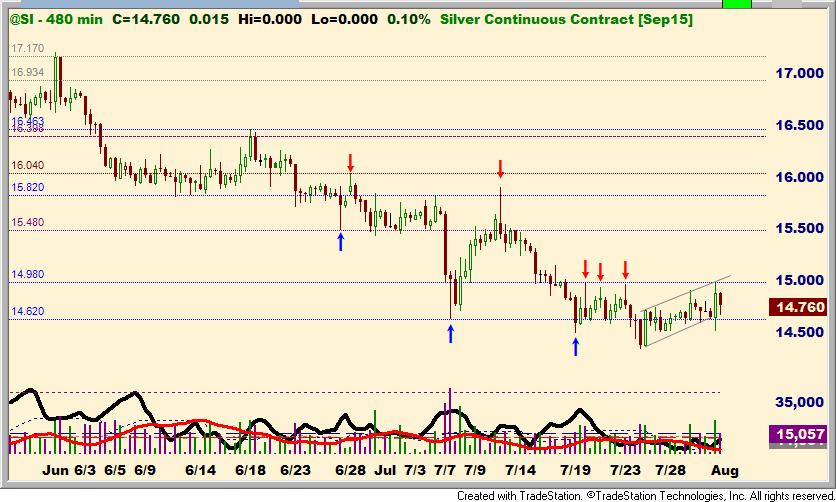
The longer term target low for Gold near 1090 is being tested now. Long term resistance for Gold is near 1440. Gold and Silver are nearing intermediate term support now. If they can hold near recent lows, an intermediate term rally is possible.
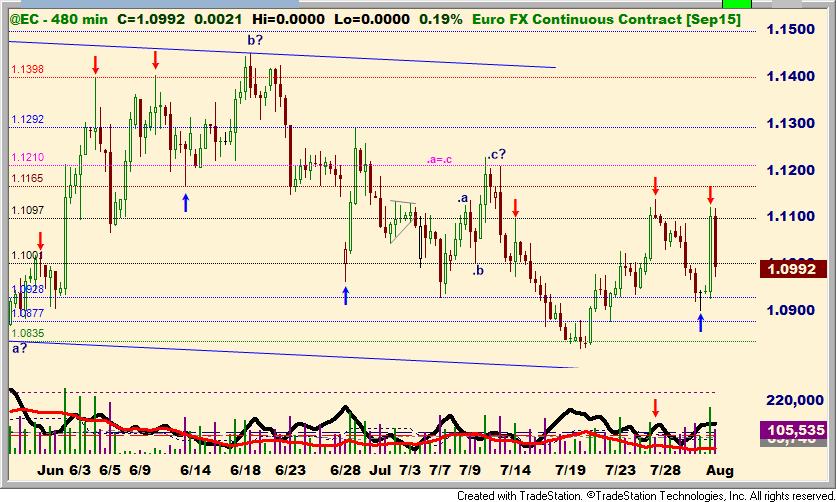
The Euro is still trending lower longer term, but has rallied intermediate term to previous ".4" resistance at 1.1474. It looks like the Euro put in an intermediate peak near 1.1486 basis September. Short term the Euro may be bottoming.
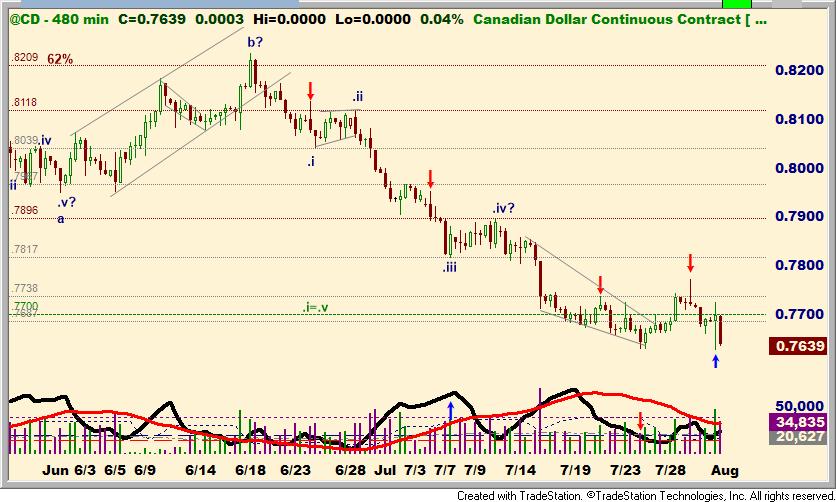
The Canadian is still trending lower intermediate to long term, but it looks like it's getting near a possible short term low.
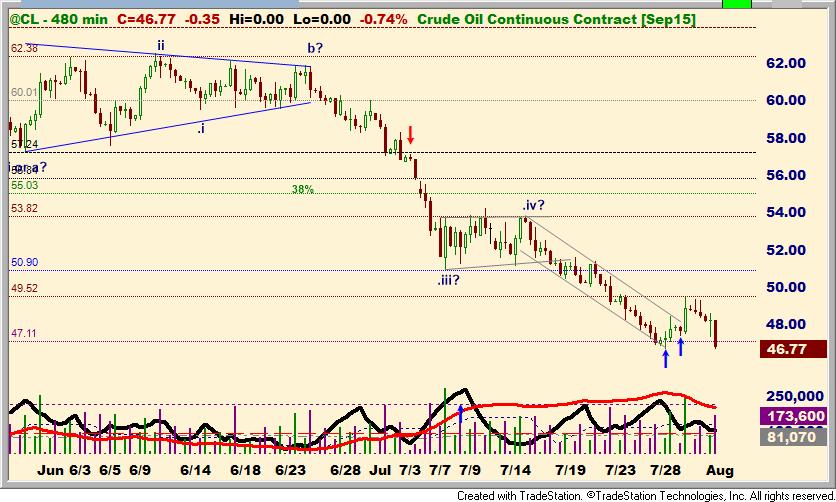
Crude Oil is now trading in the September contract. The long term is still pointing lower with long term support near 38.00 - 42.00. Crude hit 42.03 basis the expiring April contract, forming an intermediate term low. Longer term resistance near 64.27 basis September was tested and has held so far. Crude is nearing intermediate term intermediate term support at 47.11. The short term pattern suggests a bounce is possible, but it needs to rally soon. A failure to hold 47.00 could lead to a retest of 42.00.
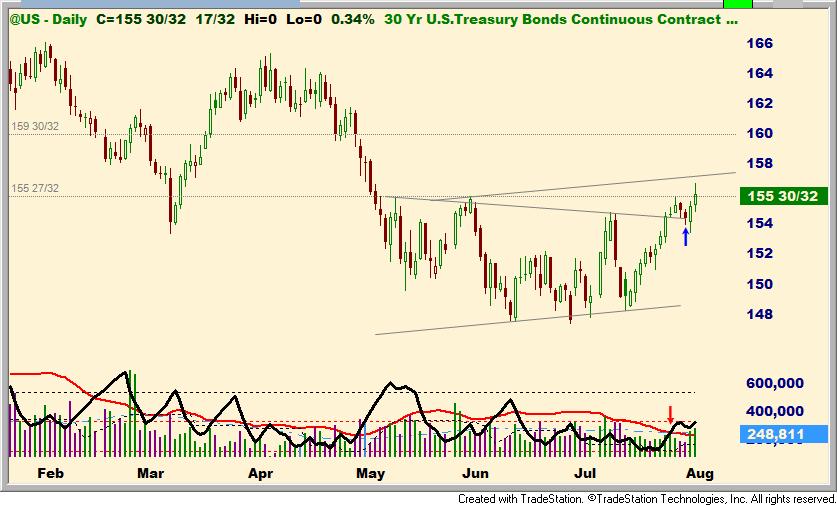
Bonds look to be peaking longer term. Bonds are retesting 155.27 now and have pushed slightly above that resistance. If Bonds can hold the breakout above 155.27 next week, next resistance is near 157.07, and then near 160.
Next report should be Tuesday.
Charts and Analysis
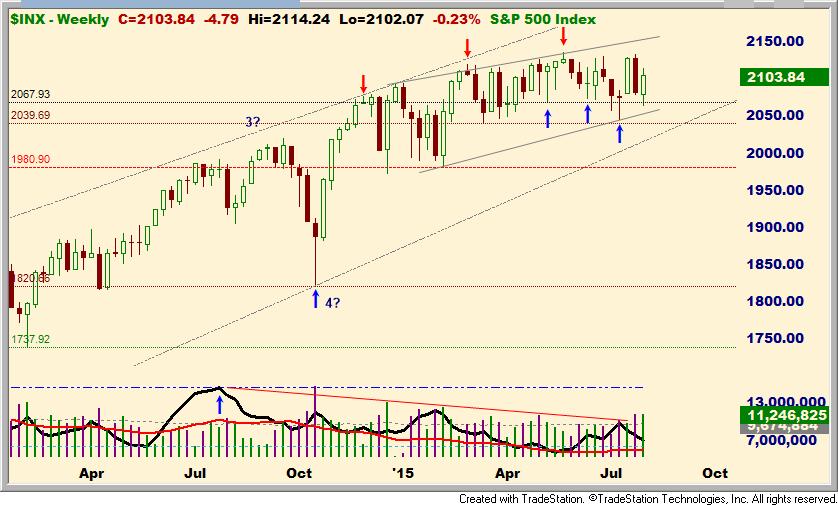
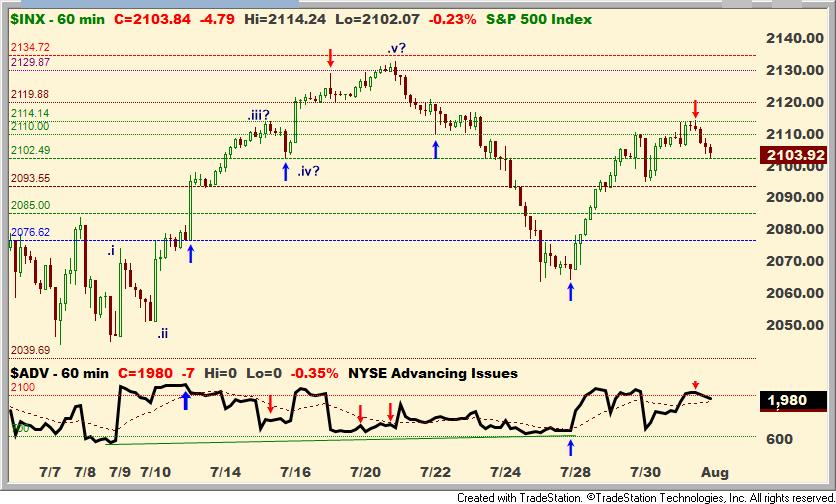
The S&P's pattern still remains ambiguous intermediate term. Recent rallies and declines both look impulsive. At Friday's
close the S&P has a net gain of about .5% since the December 2014 peak. Nonetheless, the short term pattern still allows
for new highs if the 2040 area can hold. If the S&P can hold 2040, an ideal scenario might be a peak near the upper
channel around Labor Day (at the end of August or in early September).
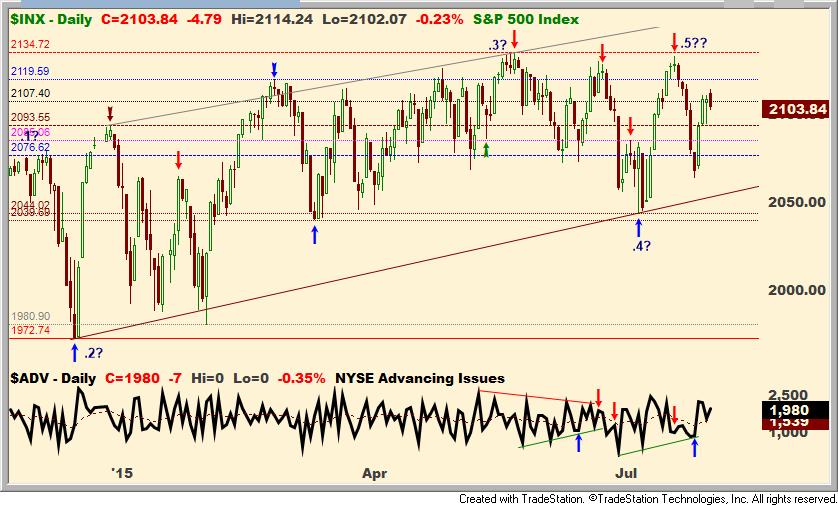
If 2040 breaks, the long term trendline comes into play near 2020. Next long term support is then 1980 and 1820.
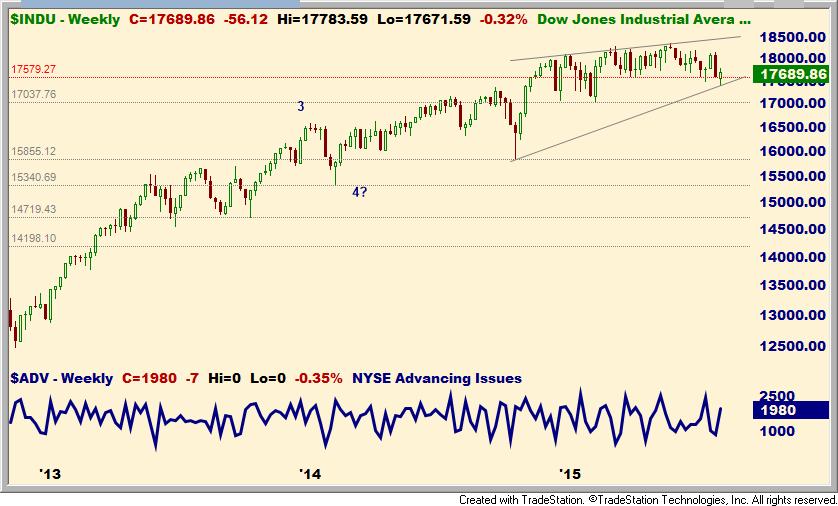
The Dow is relatively weak, and it looks more like it may have already topped. Longer term support is near 17,038.
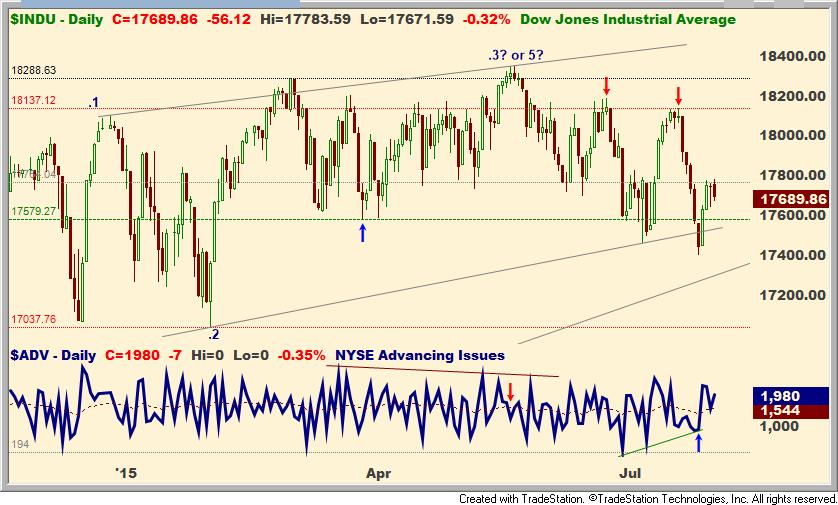
The Dow is actually down about 2% from the December 2014 peak. Nonetheless, a test of the upper channel near 18,500
is still possible. A rally through 18,140 favors new highs. A break of 17,037 increases the odds a top is in.
Breadth is rolling over a bit and short term momentum waned near Friday's peak. Short term support is near 2100 - 2102,
2093 - 2095 and 2085. If it can hold 2085, another run at the highs is likely.
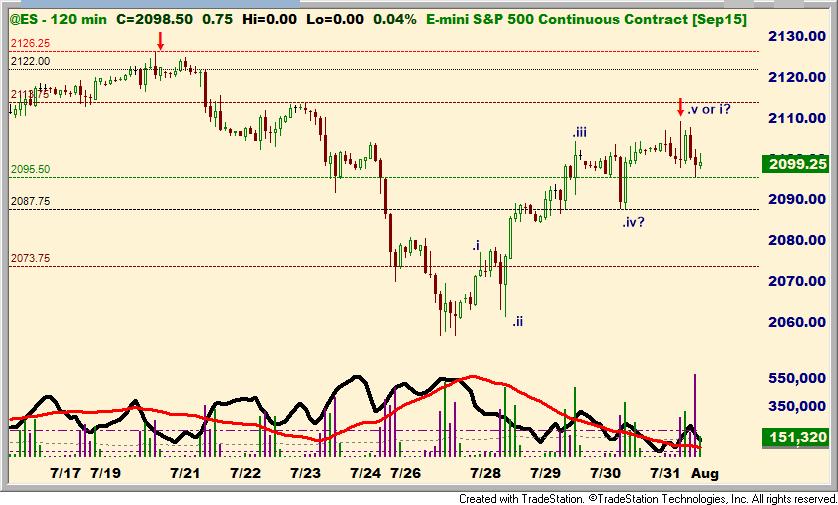
The ES can count as a small scale ".v" up. That favors a small corrective decline and then another rally above 2110. This
assumes the corrective decline holds a higher low. Support is near 2095, 2088 and 2074.
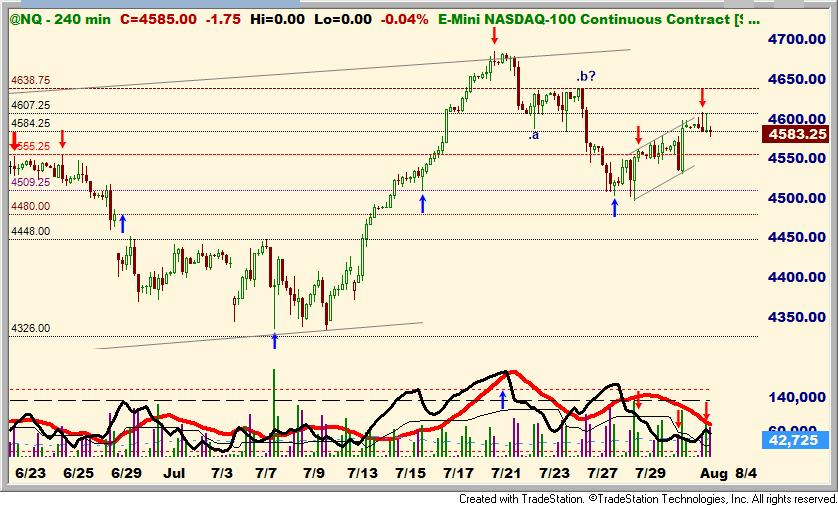
The NQ's rally looks more corrective. Two gravestone dojis peaked near 4607 resistance. A drop under 4530 favors new
short term lows. A rally through 4639 favors another run at the upper channel.
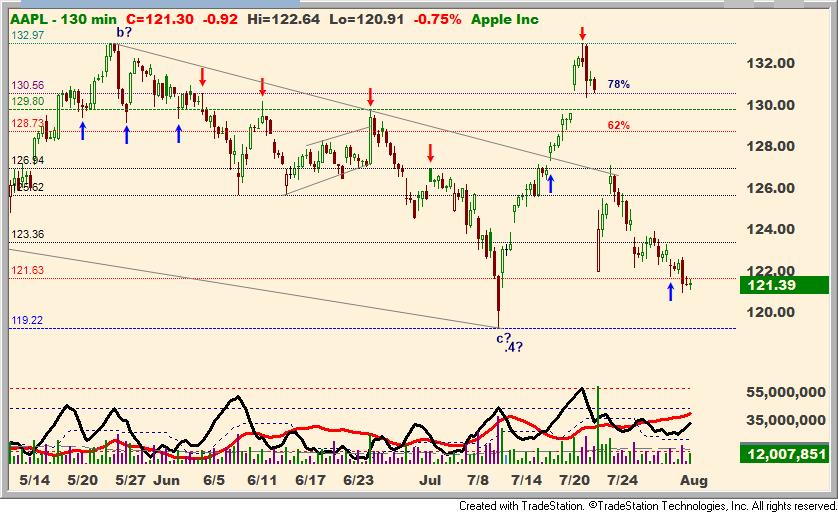
Apple remains relatively weak (putting a drag on the Nasdaq). Next support is near 119.22.
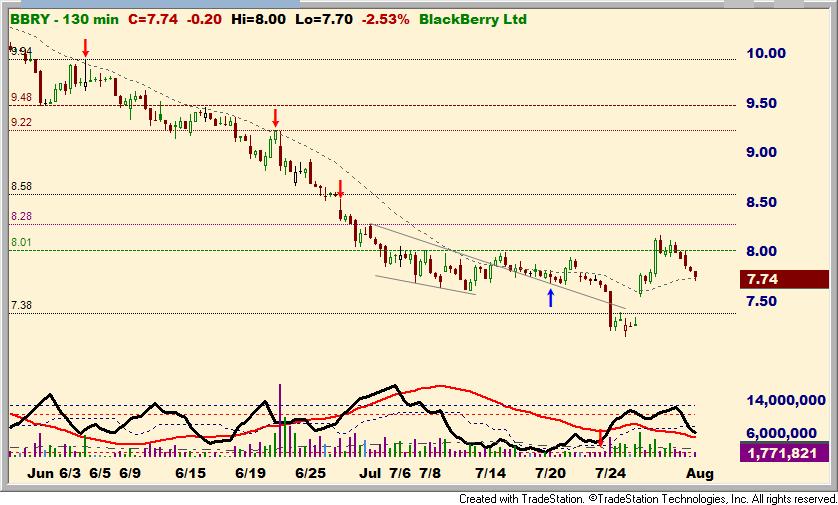
BBRY needs to form a higher low to keep the bottoming process going.
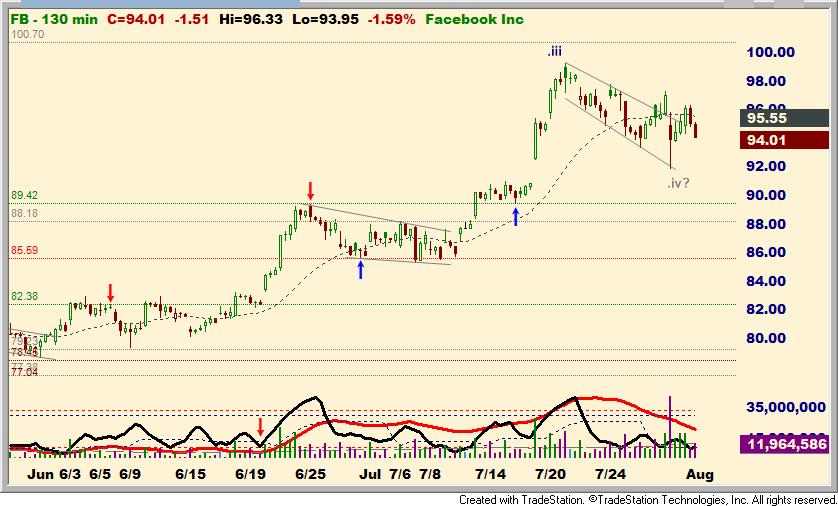
Facebook's decline still looks corrective, but the rallies have been weak. New highs are somewhat in question.
The Euro is whipsawing around within its short term range making the short term pattern ambiguous.Resistance is near
1.1100, support is near 1.0930.
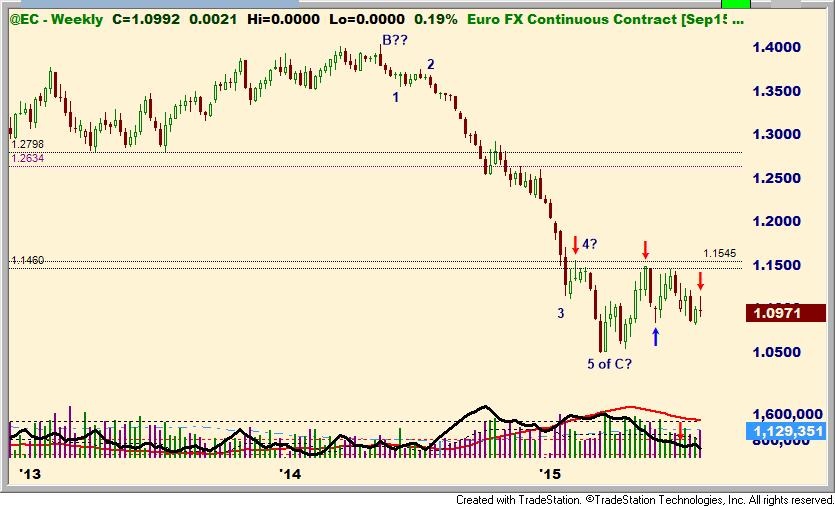
The weekly bar formed a doji, leaving the Euro virtually unchanged for the week.
The Canadian is right at previous lows. It still looks like it may be trying to bottom, but it needs to rally now to confirm the low.
Gold and Silver's rallies look corrective so far. New lows are still possible.
Resistance for Gold is near 1109.
Resistance for Silver is near 14.98.
Crude faltered near 49.50 resistance. New lows are likely short term, unless it can rally through 49.50.
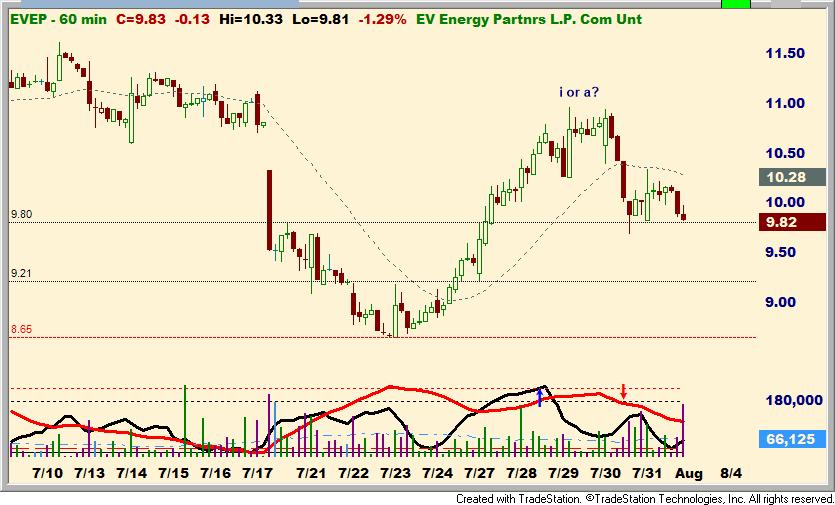
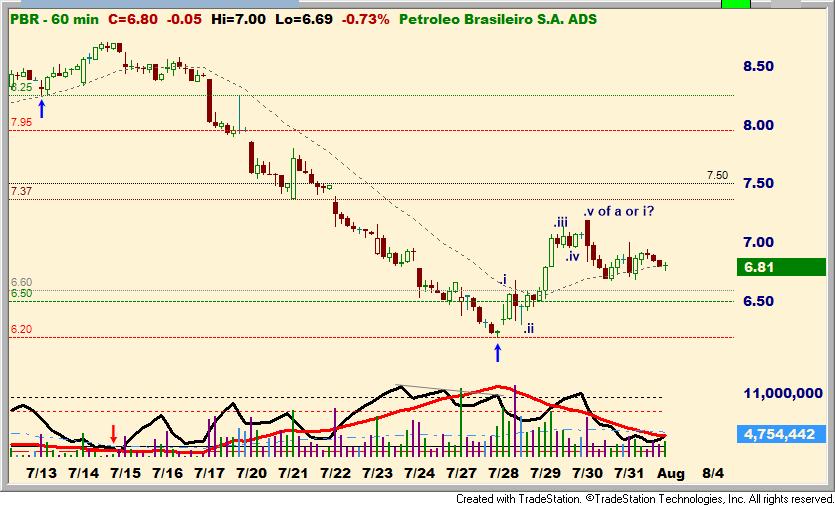
EVEP and PBR look to be in short term corrective declines.
If the decline is indeed corrective, EVEP should find support near 9.20 or higher. A drop under 8.65 breaks the "bottom".
PBR should find support in the 6.50 - 6.60 range, or new lows will become more likely.
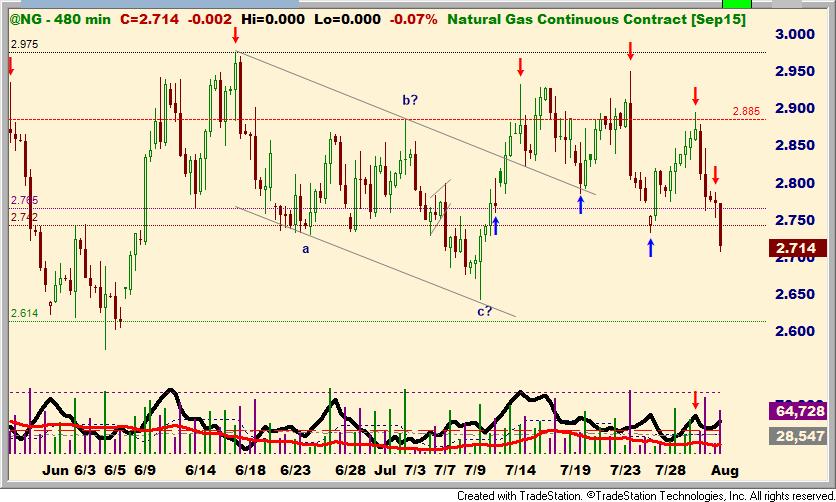
Natural Gas broke 2.74 - 2.76 support. That area could now become resistance. A retest of 2.60 or lower is likely as long
as 2.90 basis September is not exceeded.
Bonds rallied on weakness in Crude, Currencies and the lack of follow through in Metals.
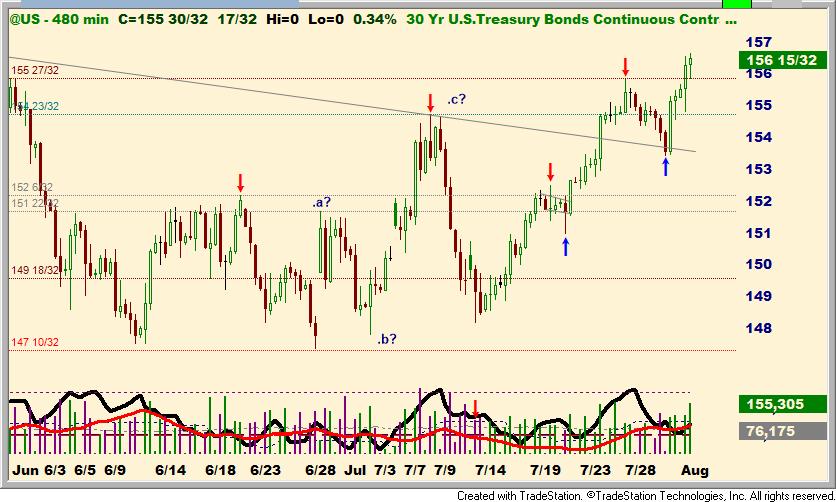
Next resistance assuming Bonds can hold this breakout is near the upper channel at 157.07, and then near 160.
Please use Bill@SmartTrades.com email for contact and billing questions.
Smarttradesreports@gmail.com is used to send a backup copy in case emails are rejected as spam.
I don't check smarttradesreports@gmail.com as frequently for incoming emails.
Smart Trades Website: http://www.smarttrades.com/
Join me on Twitter @ https://twitter.com/#!/BillSmartTrades for live updates and real time trades.
If you join Twitter you can see updates on my twitter page, or texted to your phone: it's your choice
as to how to follow. I try to update on Twitter several times a day. Please be sure to email me your twitter handle
as I get lot's of unsolicited requests. Also, be sure to send a follow request via twitter: this must be initiated from your side.
Twitter help FAQ:
https://support.twitter.com/groups/34-apps-sms-and-mobile/topics/123-mobile-basics/articles/14014-twitter-phone-faq
If you like my reports, please refer a friend. I'll comp a free month for each paid referral subscription (a $49 value).
Elliott Wave basics:
http://stockcharts.com/school/doku.php?id=chart_school:market_analysis:elliott_wave_theory
Candlestick basics:
http://www.investopedia.com/articles/technical/02/121702.asp
http://www.investopedia.com/terms/d/doji.asp
http://www.investopedia.com/terms/g/gravestone-doji.asp
http://www.investopedia.com/terms/d/dragonfly-doji.asp
Entire publication © Smart Trades Inc. 2015 All rights reserved.
All Charts & Quote Pages in this publication created with TradeStation (r) 9, copyright TradeStation Technologies.
This post is for educational purposes only.
TRADE AT YOUR OWN RISK!
NOTICE: Traders can and do lose money. No claims are made that the information provided here will insure gains or prevent loses.
NOTICE: Neither the information, the systems, nor any opinion expressed herein constitutes a representation by Smart Trades Inc., or a solicitation for the purchase or sale of any commodity futures, stocks or options of any kind. Those using the information and systems herein for trading purposes are responsible for their own actions and no claim is made that the recommendations or systems will be profitable or that they will not result in losses. Smart Trades owners, employees, or members of their families may have a position in the markets contrary to the information or systems contained herein.
NO CLAIMS ARE MADE THAT THE INFORMATION PROVIDED HERE IS CORRECT. EPS, YIELDS, ETC. ARE SUBJECT TO CHANGE.
TRADE AT YOUR OWN RISK!
PLEASE NOTE THAT THERE IS AN INHERENT RISK OF LOSS ASSOCIATED WITH TRADING FUTURES, STOCKS AND OPTIONS CONTRACTS, EVEN WHEN USED FOR HEDGING PURPOSES. PLEASE CAREFULLY CONSIDER YOUR FINANCIAL CONDITION BEFORE INVESTING IN FUTURES AND OPTIONS CONTRACTS. FUTURES AND STOCK TRADING IS NOT SUITABLE FOR ALL INVESTORS. NO CLAIMS ARE MADE THAT THE INFORMATION PROVIDED HERE WILL INSURE GAINS OR PREVENT LOSES.
PAST PERFORMANCE IS NOT NECESSARY INDICATIVE OF FUTURE RESULTS.
This post is for educational purposes only.
TRADE AT YOUR OWN RISK!
All Charts & Quote Pages in this publication made with Omega Trade Station (r) 8
NOTICE: Traders can and do lose money. No claims are made that the information provided here will insure gains or prevent loses.
NOTICE: Neither the information, the systems, nor any opinion expressed herein constitutes a representation by Smart Trades Inc., or a solicitation for the purchase or sale of any commodity futures, or options of any kind. Those using the information and systems herein for trading purposes are responsible for their own actions and no claim is made that the recommendations or systems will be profitable or that they will not result in losses. Smart Trades owners, employees, or members of their families may have a position in the markets contrary to the information or systems contained herein.
PLEASE NOTE THAT THERE IS AN INHERENT RISK OF LOSS ASSOCIATED WITH TRADING FUTURES, STOCKS AND OPTIONS CONTRACTS, EVEN WHEN USED FOR HEDGING PURPOSES. PLEASE CAREFULLY CONSIDER YOUR FINANCIAL CONDITION BEFORE INVESTING IN FUTURES AND OPTIONS CONTRACTS. FUTURES AND STOCK TRADING IS NOT SUITABLE FOR ALL INVESTORS. NO CLAIMS ARE MADE THAT THE INFORMATION PROVIDED HERE WILL INSURE GAINS OR PREVENT LOSES.
TRADE AT YOUR OWN RISK.
PAST PERFORMANCE IS NOT NECESSARY INDICATIVE OF FUTURE RESULTS.