
 Tweet
Tweet
Smart Trades Inc.
Expert market forecasting services
Excerpts from recent newsletters:
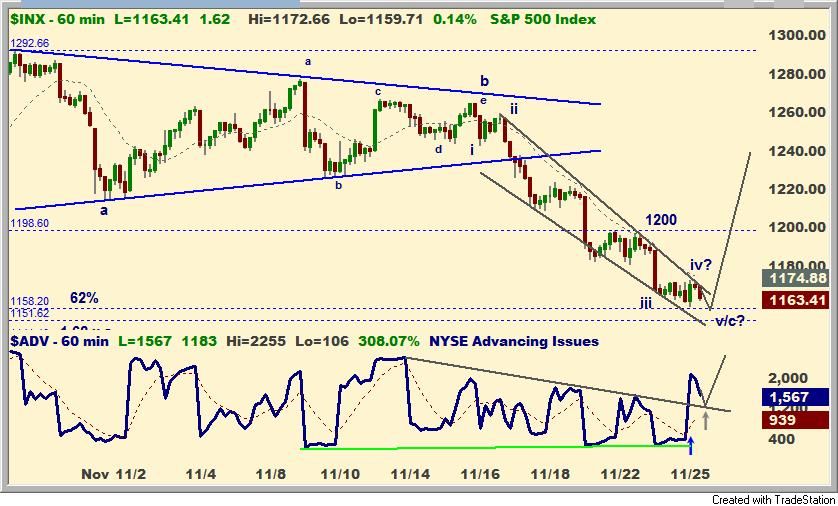
Smart Trades Update 11.27.11
On 11.17.11 I said:

"The 1150-1160 area basis the INX cash is a preliminary target zone."


And on Twitter Friday (11.25.11) before the close:

"Moderate new lows, with continued strong breadth, *and* a quick upside
reversal would be OK (likely at least a short term 5th wave low)."

"INX 1157 or so would be a "i=v" in the 1150-1160 zone."

The INX hit 1158.66 late Friday. The S&P futures are up about 24 points (2%) from there Sunday evening.
It's possible a short term low is in place, but we need to hold 1258 early this week and then clear
resistance near INX 1200. If we don't hold, next support is 1140 in the S&P and 2110-2120 in the
Nasdaq 100 (NDX).

Here's the chart form Twitter updated through Friday's close:
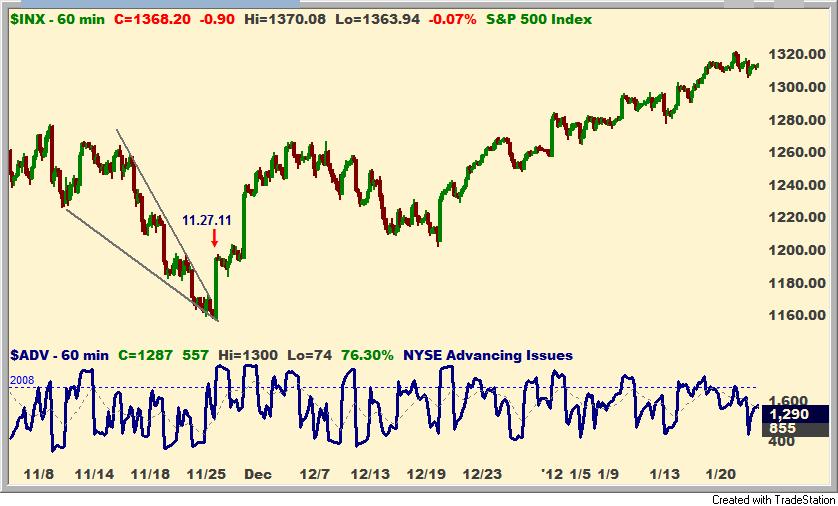
Here's what happened:
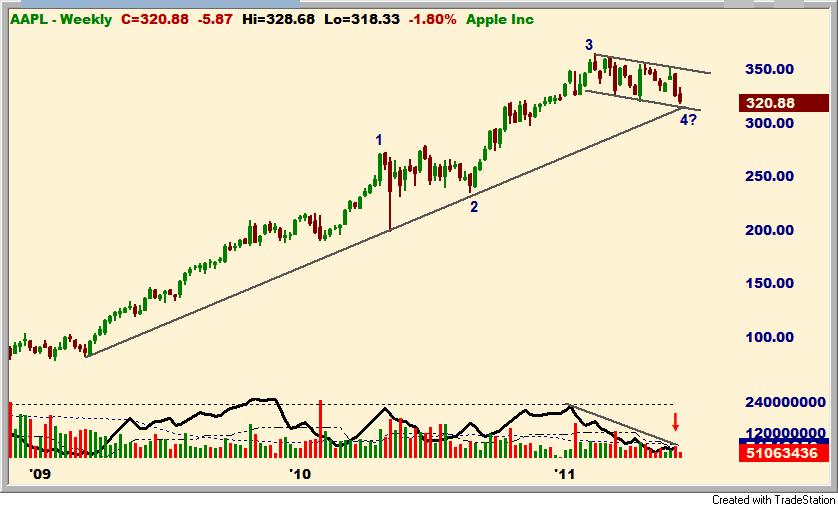
From: Smart Trades Update 6.16.11
Finally, Apple has broken its triangle pattern. This tends to
make me favor the
expanded flat count for the broader market as well. The lower trend
line of the
bull flag pattern will intersect with the rising long term trend
line near 315. A
solid break of 300-315 in Apple would make me reconsider this
pattern for both
AAPL and the broader market. Please note volume and momentum are
both
waning on the decline (so far) which is consistent with a
corrective decline:
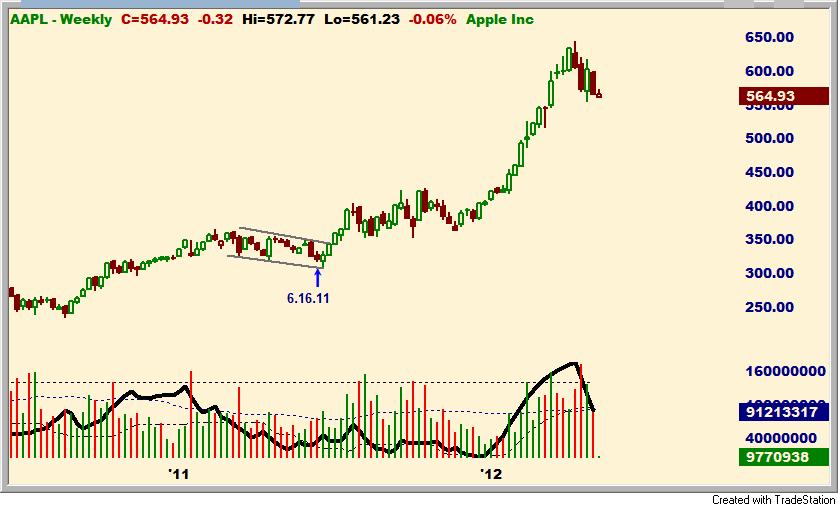
Apple as of 5.7.12:
Smart Trades Update 5.2.12
It looks like we have a short term top in the S&P and Nasdaq.
Yesterday I posted this chart of the INX.
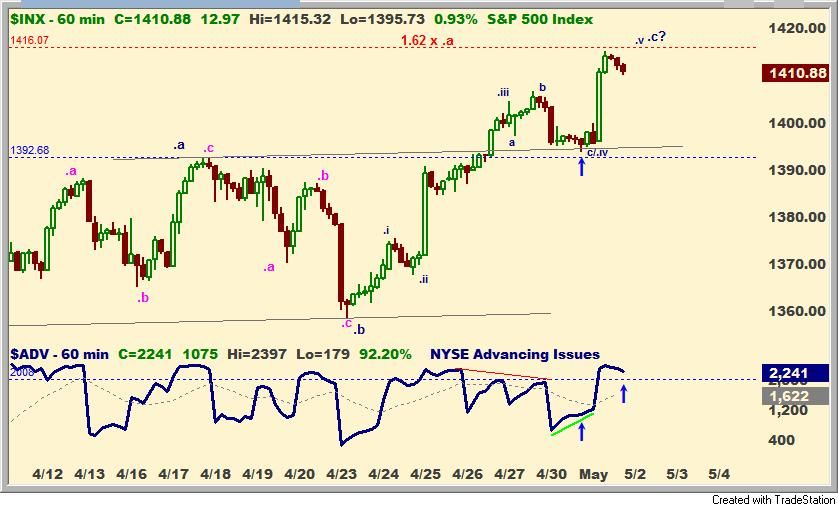
(and):
Next target under 1360 if it plays out. A rally above 1416 breaks the short term bearish pattern.
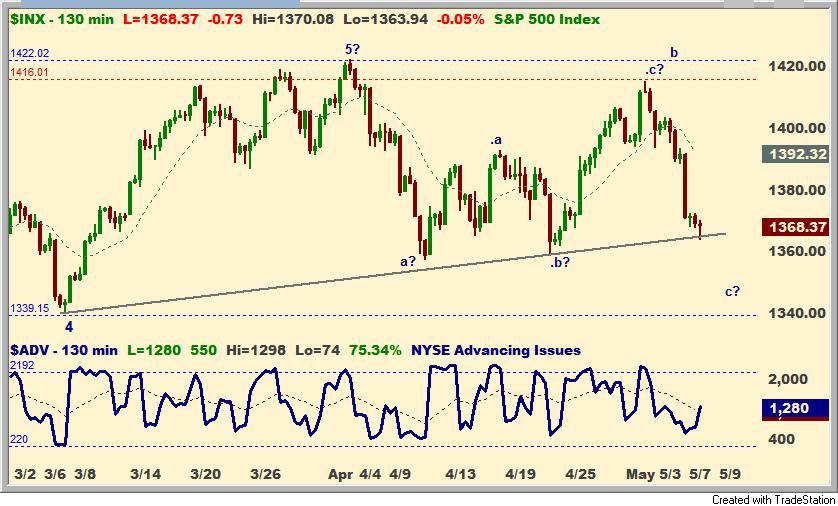
As of 5.7.12 here's how it's worked out:
Monthly Subscription $49
TRADE AT YOUR OWN RISK!
No claim is made that the recommendations or systems will be profitable or that they will not result in losses.